We are excited to announce the preview of DataSet KubeiQ, an algorithmic approach to automatically detect anomalies no matter where they occur across the Kubernetes cluster - the underlying infrastructure, the Kubernetes platform, or deployed workloads. The innovation enables DevOps and Site Reliability Engineering (SRE) teams to expedite investigations related to Kubernetes, reduce mean-time-to-resolve (MTTR), and improve end-user experience.
DevOps engineers and SREs use static thresholds based alerts, heuristics, or triangulation based on trial and error to investigate incidents within dynamic, containerized environments in an effort to find the most meaningful signals. Now, teams can streamline this process with DataSet KubeiQ, which automatically bubbles up anomalies in Kubernetes clusters.
Quickly Detect and Resolve Anomalies No Matter Where They Occur in Kubernetes Cluster
DataSet continuously observes the entire cluster and automatically surfaces meaningful insights related to anomalies, such as
- A high number of unhealthy nodes due to memory, disk, or CPU pressure
- A high number of unhealthy pods remain in the Pending status
- A high number of unavailable Kubernetes Deployments
- A high number of restarted containers
Due to the ephemeral nature of containerized infrastructure, some of the scenarios mentioned above are expected, such as container restarts. Kubernetes is self-healing and automatically corrects when anomalies occur unless there is a system-wide issue such as resource starvation. The challenge is to determine when a performance signal indeed becomes an anomaly.
DataSet continuously analyzes your Kubernetes cluster and leverages machine learning to understand when activity deviates from its historical baseline to be considered anomalous.
Using DataSet, engineers can effectively resolve performance incidents faster than ever before, regardless of their prior knowledge of Kubernetes technology.
For example, if you are an SRE who recently joined an e-commerce company that runs several services on Kubernetes, you want to get notified when the latency of a service exceeds a threshold. What threshold would you like to set, so you get alerted when there is an anomaly? Many variables can affect the latency of a particular service, such as the rate of requests, errors, or even infrastructure performance, for several reasons. Creating an alert on a static threshold is simplistic and almost always results in alert storms.
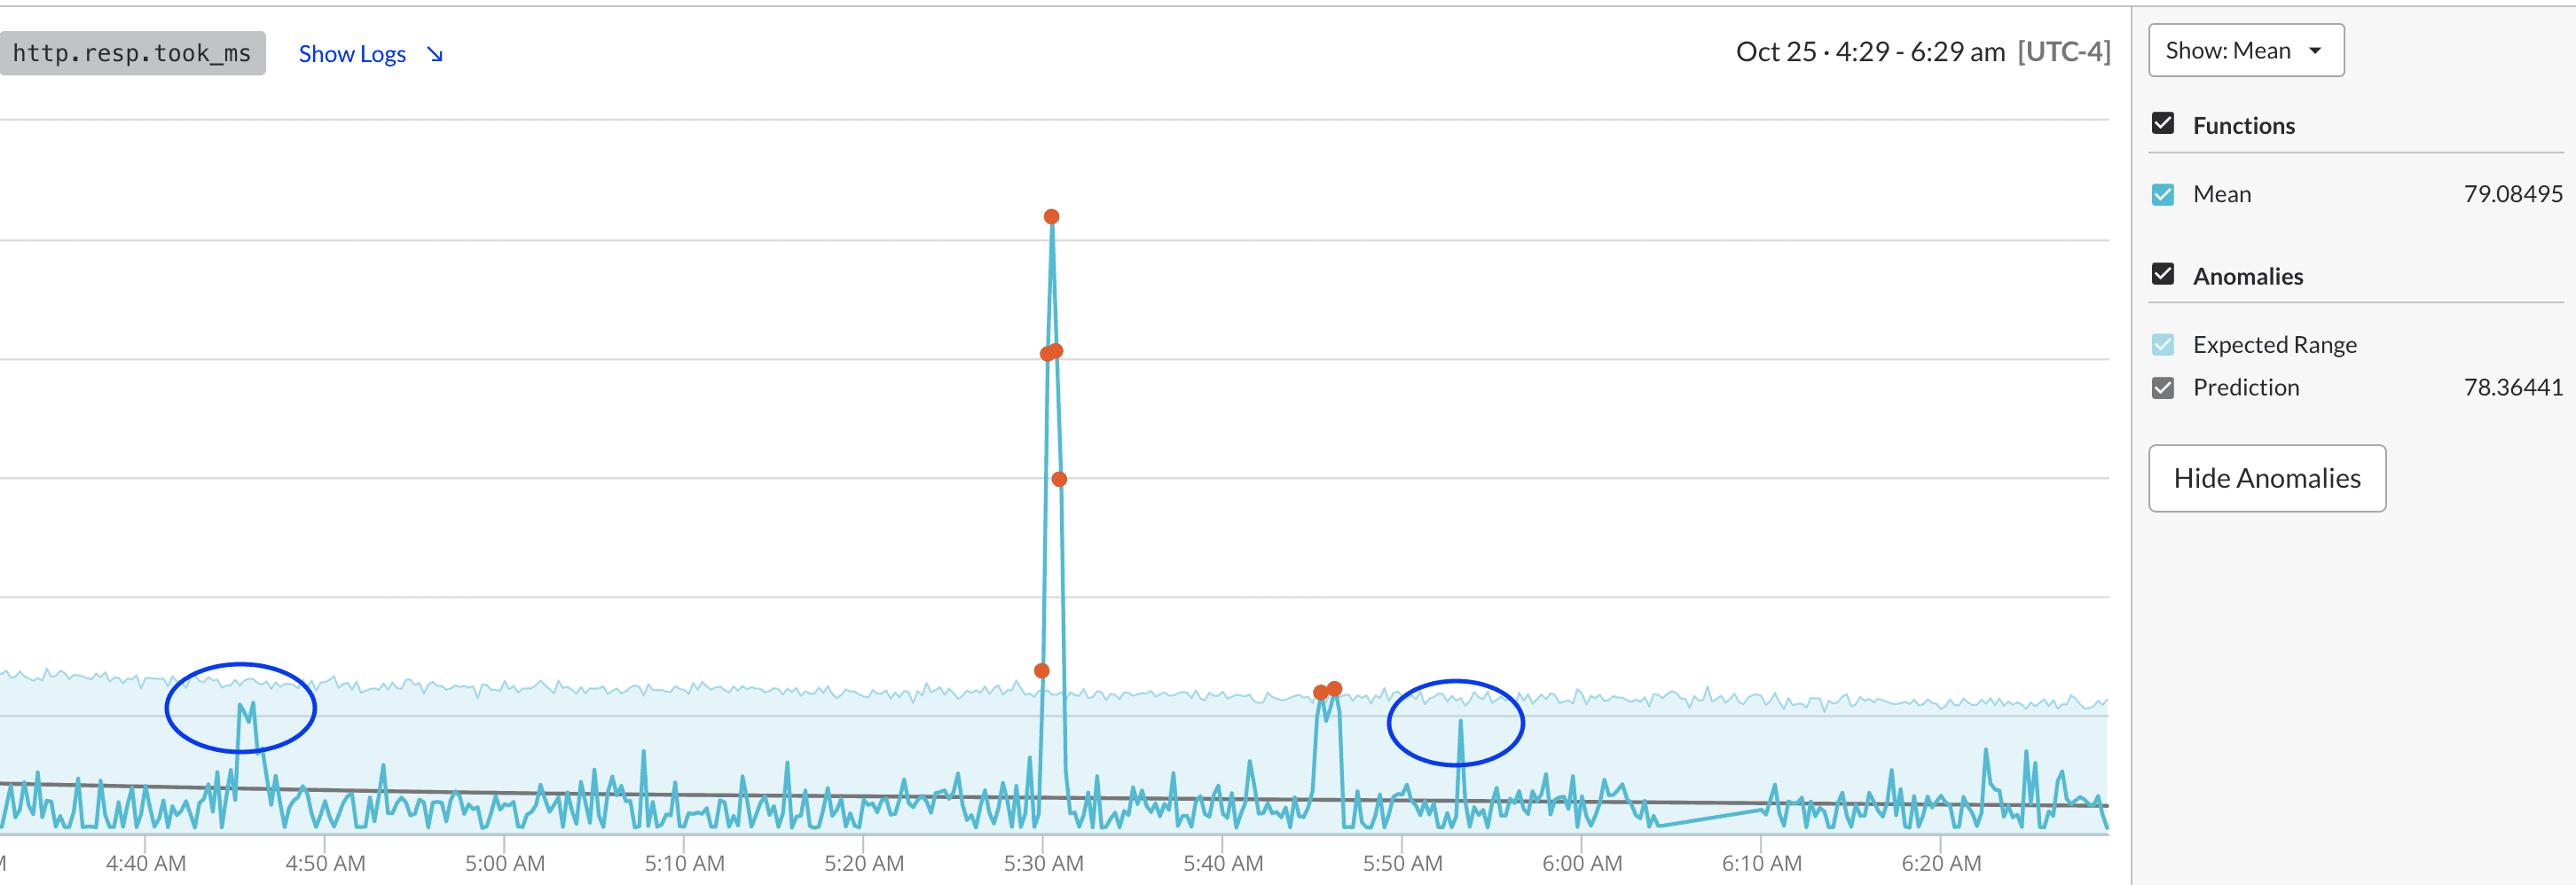
KubeiQ uses machine learning to automatically determine truly anomalous patterns and surface those up so that you can get alerted when there might be a systematic issue. In this example, you can see spikes in a frontend service's latency.
You'd have gotten false alerts multiple times if an alert was set based on static thresholds. KubeiQ dynamically sets thresholds and calculates a performance metric's expected range.

You are alerted only when the actual value exceeds the confidence interval, which is dynamically created based on historical performance, thus minimizing alerts and the cognitive overload associated with triaging such incidents.
A quick pivot to logs indicates that infrastructure was starved of resources, and one of the replicas of this service was evicted.

You can automate the response and resolution for such conditions using an auto-scaler that dynamically provisions just the right compute resources to handle your cluster's applications.
Another pertinent consideration is the ephemerality in dynamic Kubernetes environments. You want to monitor pod restarts to proactively get alerted about a system wide issue. However, you know that not every occurrence of these events indicates an anomaly. Kubernetes is self-healing, so if a pod is evicted or stopped, Kubernetes will reschedule or restart it to match the desired state.
So should you be alerted on pod restarts? Again, static thresholds no longer work in the dynamic Kubernetes and container environments. KubeiQ correctly analyzes these dynamic events and alerts you only when it is determined that pod restart exhibit anomalous patterns and warrants your attention.

In this case, even though there is variation in the number of pod restarts across the system, it is within the expected range as predicted by KubeiQ.
KubeiQ proactively analyzes the performance of the entirety of the Kubernetes clusters and expedites the process of detecting and troubleshooting performance anomalies. Engineering teams can now effectively identify anomalies in far less time, regardless of their prior knowledge of the Kubernetes platform or the underlying infrastructure.
Get Started with DataSet to Automate Kubernetes Monitoring
DataSet KubeiQ, a part of Kubernetes Explorer is deployed as a one-step helm installation and works with all flavors of Kubernetes - native upstream distribution, Amazon EKS, Google Cloud GKE, Microsoft Azure AKS, or Red Hat OpenShift.
Powered by unique architecture, DataSet combines high performance, low overhead, index-free design, and massively parallel processing that unlocks an unmatched analytics experience at a fraction of the cost.
If you haven’t started with DataSet yet, we invite you to try fully-functional DataSet for 30 days, completely free. Request a demo; we’d love to show you how DataSet can enable all your teams to troubleshoot Kubernetes efficiently.
Meet us at KubeCon or SREcon Europe
Heading to KubeCon + CloudNativeCon North America in Detroit or SRECon Europe in Amsterdam? The DataSet team will be in full force to greet you there. Meet us to get a personalized demo, collect awesome swag, and win exciting prizes!

