We are excited to announce the general availability of DataSet Kubernetes Explorer for our customers. Kubernetes Explorer is an intuitive and cost-effective way to understand and manage the health and performance of Kubernetes clusters, deployed applications, and underlying infrastructure. Kubernetes Explorer continuously collects metrics, events, and logs from the entire Kubernetes stack, surfaces anomalies, uncovers their root causes, and provides contextual logs, so DevOps, SRE, and engineering teams can triage and troubleshoot independently – faster than ever before.
Enterprises strive for operational efficiencies, multi-cloud portability, and agility by deploying and running applications on Kubernetes. While Kubernetes has emerged as the ‘de-facto’ standard for container orchestration (Gartner) and is getting mainstream adoption, many enterprises encounter challenges as they operationalize Kubernetes at scale.
The latest Cloud Native Computing Foundation (CNCF) survey cites monitoring and logging as the biggest challenge in adopting Kubernetes, followed by complexity and security.
Why Operationalizing Kubernetes is Challenging
As Kubernetes environments scale and applications get more distributed, DevOps, SRE, and engineering teams struggle because:
- High data volume: Distributed containerized applications generate a lot of data. Traditional tools struggle to analyze high log data volume in real-time.
- Fragmented tooling: Multiple monitoring and logging solutions trap data in silos and require teams to carry context across tools leading to higher mean-time-to-detect.
- Lack of cluster-wide access: All developers do not have cluster-level access as implementing RBAC within Kubernetes is complex, so it is difficult to troubleshoot errors efficiently and independently.
- Expensive to scale: Higher data volume in cloud-native environments increases the total cost of ownership by orders of magnitude.
SREs and DevOps engineering teams spend the bulk of their time answering basic questions regarding the performance of Kubernetes and deployed applications. Scale increases the effort required to detect and troubleshoot problems. Traditional log data platforms were designed decades ago in the pre-cloud era; they don’t work for modern K8s environments. They are slow, siloed, expensive to scale, and complex to operate.
Introducing DataSet Kubernetes Explorer
Kubernetes Explorer is a turnkey solution that makes it easy for engineering teams to debug and troubleshoot errors no matter where they happen across the entire Kubernetes stack. Kubernetes Explorer delivers immediate value to teams starting on their Kubernetes journey while addressing challenges for complex Kubernetes deployments at scale.
Kubernetes Explorer provides an at-a-glance view into all Kubernetes clusters with the flexibility to drill down into a particular cluster, namespace, nodes, pods, containers, or deployed workloads in mere seconds. Additionally, Kubernetes Explorer provides instant visibility to lifecycle events of Kubernetes components so teams can connect the dots between distributed infrastructure and applications. A seamless pivot to contextual logs gives granular visibility, helping organizations troubleshoot and resolve anomalies quickly.
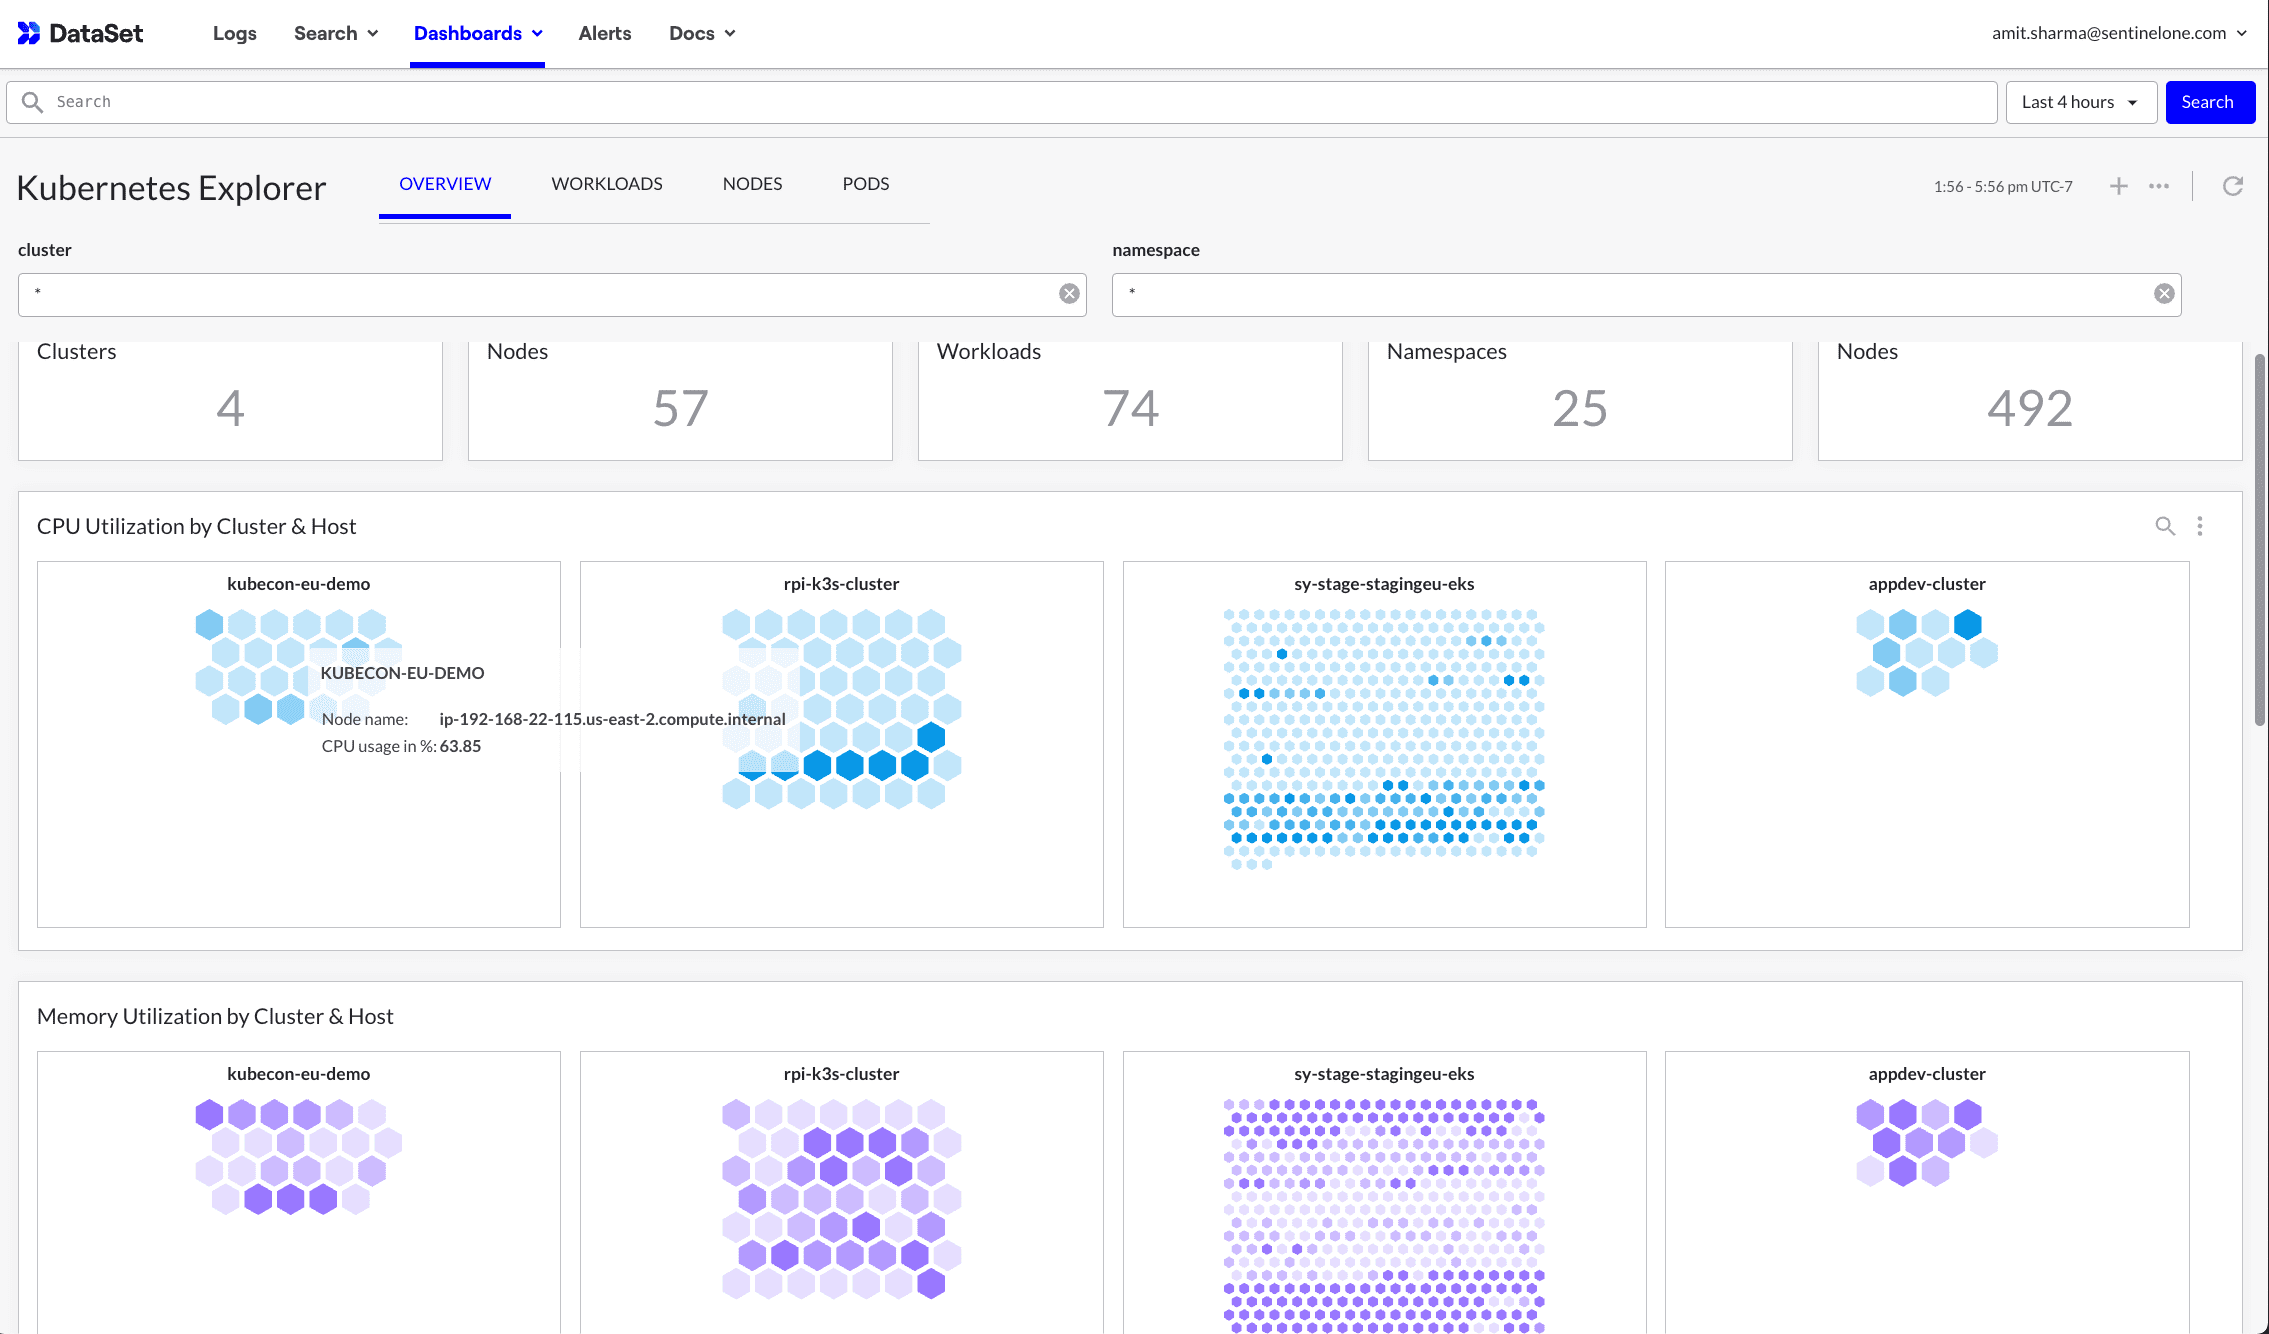
Cluster Overview
Cluster Overview is the at-a-glance view that provides visibility into all clusters, infrastructure – nodes, pods, containers running in each cluster, and applications. You can filter or search into individual components in mere seconds. Kubernetes Explorer automatically discovers Kubernetes components and containerized applications, so you get instant, out-of-the-box visibility across the entire stack.
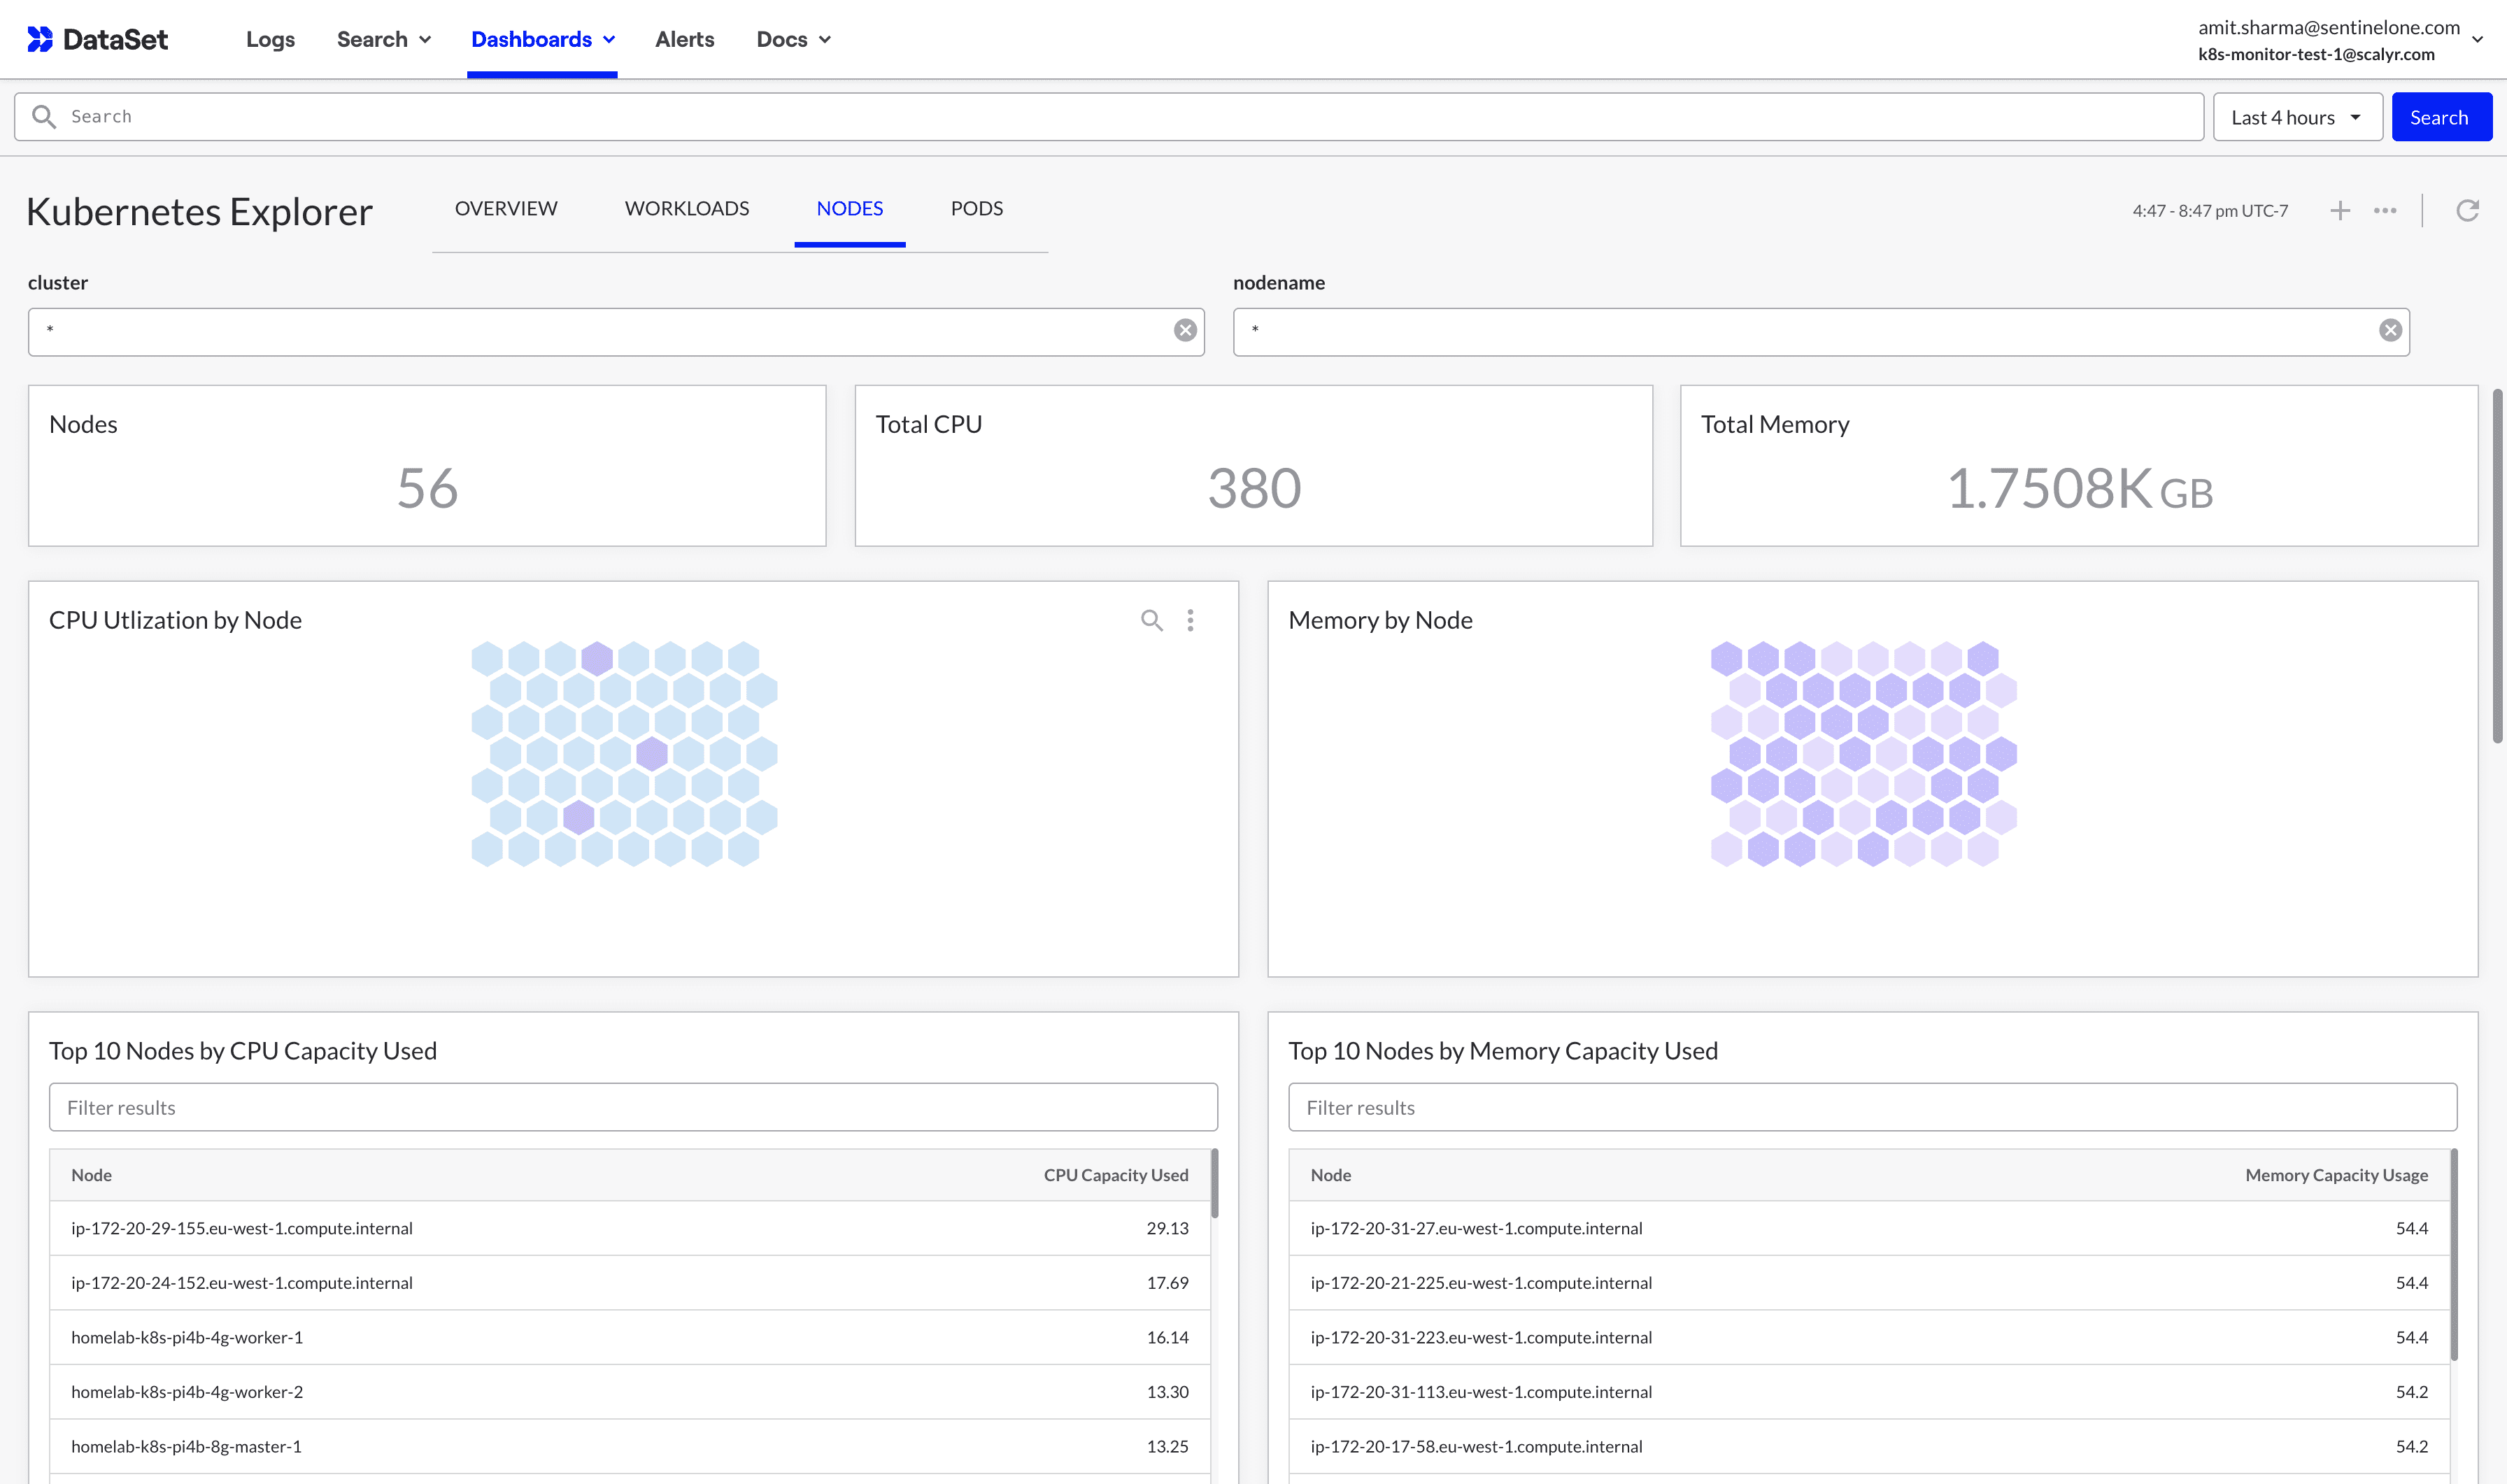
Nodes and Pods Overview
Visualize provisioned capacity and key performance characteristics such as CPU, Memory, Network, and Disk performance across clusters using pre-built, curated dashboards. Visualize and get alerted on any component trending hot and draining cluster resources, commonly known as noisy neighbor issues.
Troubleshooting Kubernetes Errors
In distributed systems such as Kubernetes, errors can occur anywhere within the stack, and troubleshooting becomes time-consuming when teams have to inspect the health of individual components and manually stitch context.
Further exacerbating the problem is the lack of cluster-level privileges for all developers. While the platform team, DevOps, or SRE teams will have access to the cluster using kubectl, the complexity of managing RBAC within Kubernetes prevents all developers from gaining such access and thus hinders their ability to troubleshoot their applications independently.
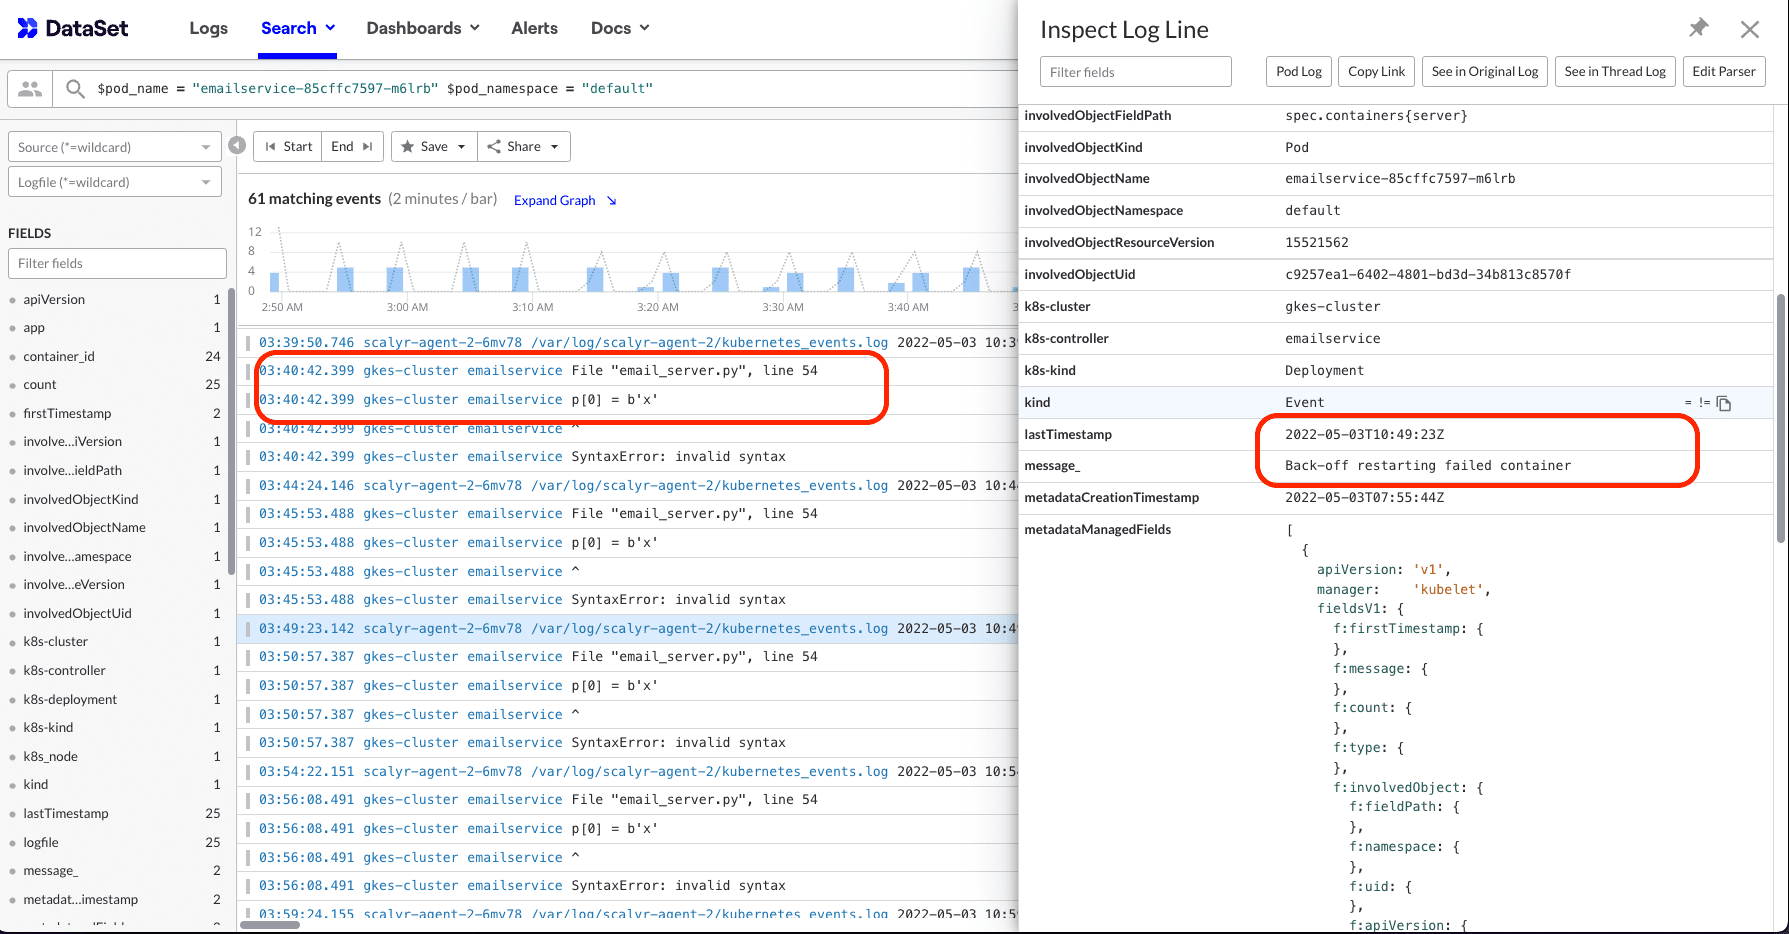
Kubernetes Explorer’s Workloads view shines in for these scenarios. It provides an out-of-the-box view of all events that happened to a particular workload.
Application engineers can click the number of events for contextual logging and detailed information about root-cause. In this example, a python application is causing the container to crash every time it starts resulting in BackOff. Using DataSet, engineers can go to the root cause - up to the line of code causing the error within two clicks.
Engineers can quickly narrow down to visualize all events that happened to the service they are supporting, while DevOps and SRE teams can look for all events across the cluster.
Full-stack visibility
Drilling down into an application from the workload tab gives out-of-the-box application performance details using RED metrics – Rate, Errors, and Duration.
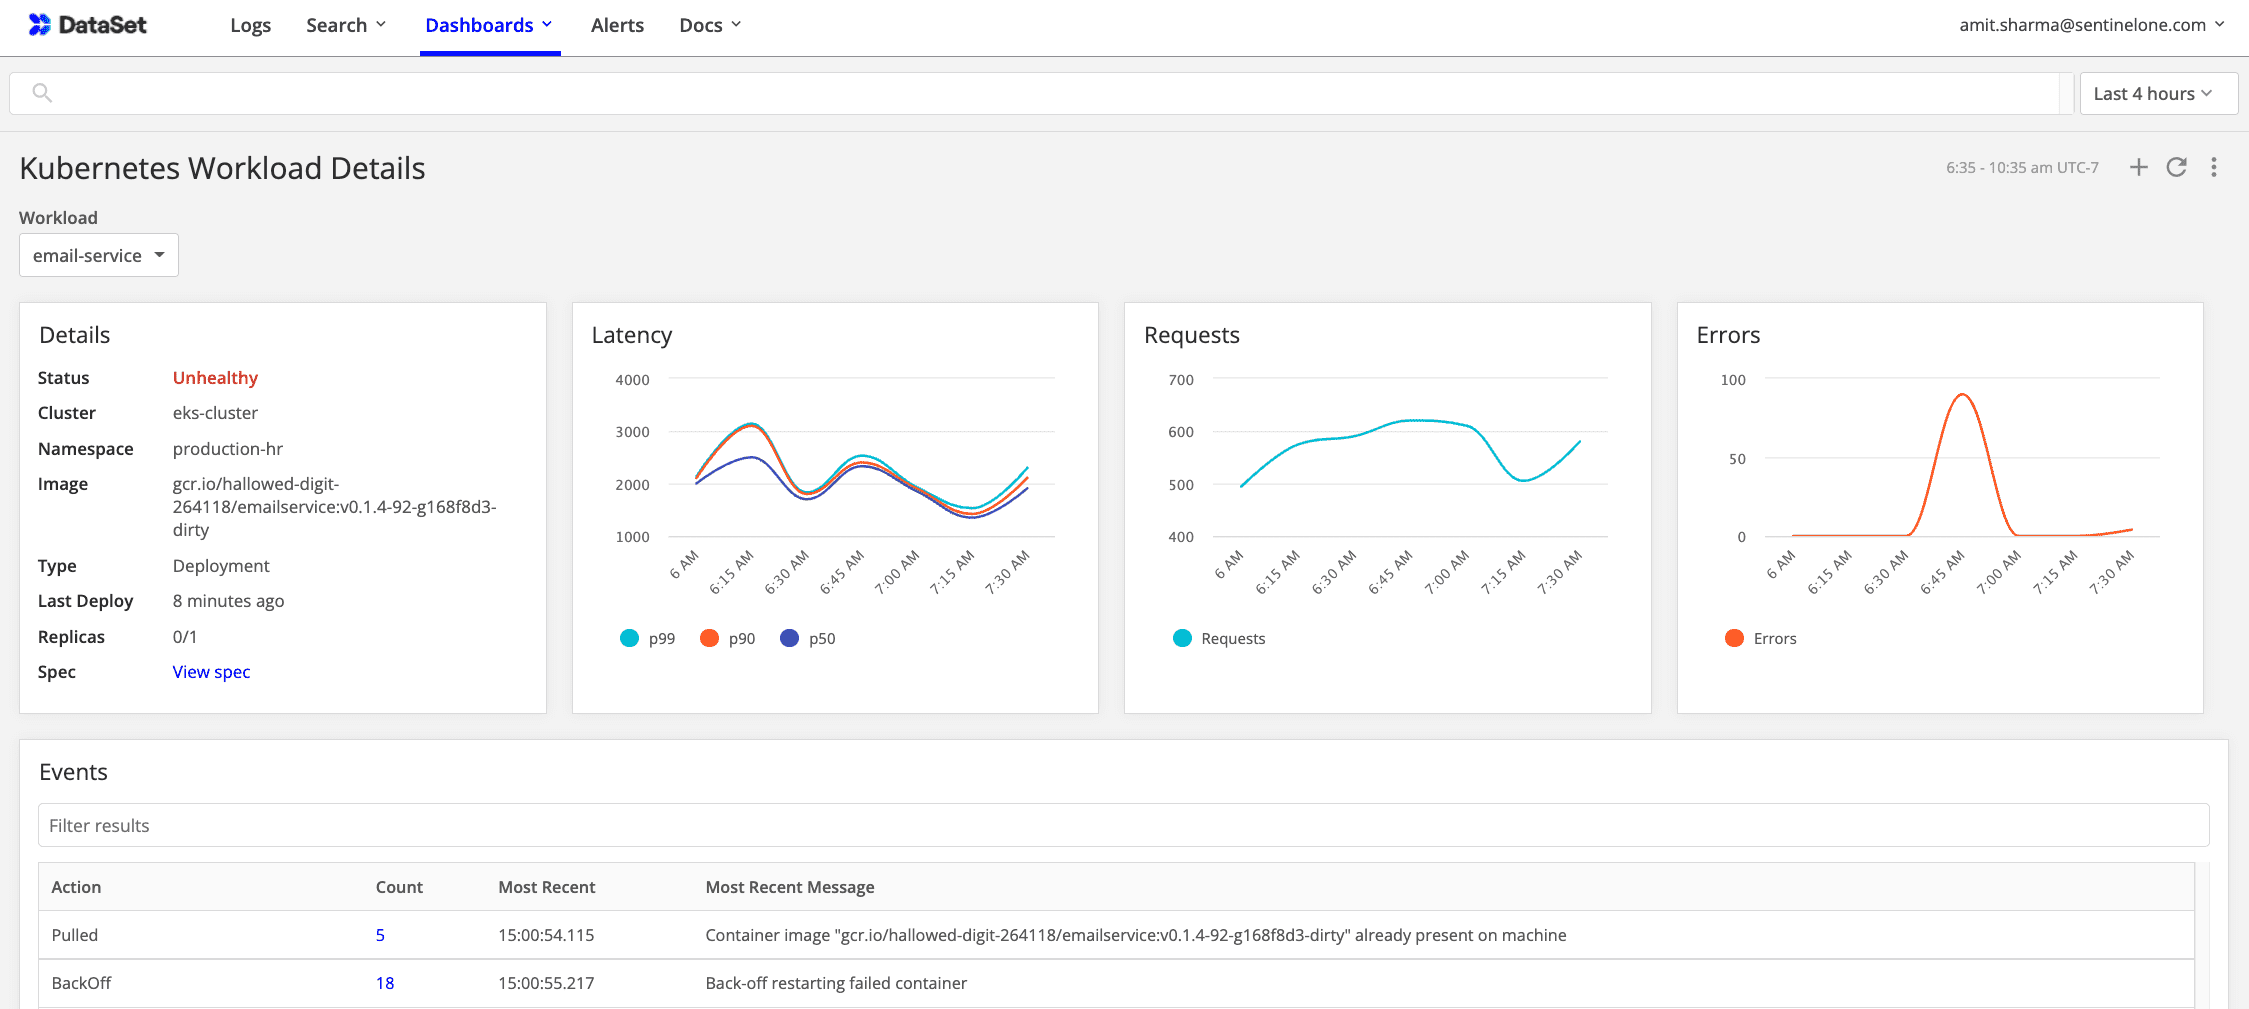
The Workload view also shows all lifecycle events that happened on applications so teams can immediately correlate performance-related incidence with Kubernetes events.
Get Started with DataSet to Simplify Kubernetes Troubleshooting
DataSet Kubernetes Explorer is deployed as a one-step helm installation and works with all flavors of Kubernetes - native upstream distribution, Amazon EKS, Google Cloud GKE, Microsoft Azure AKS, or Red Hat OpenShift.
Powered by unique architecture, DataSet combines high performance, low overhead, index-free design, and massively parallel processing that unlocks an unmatched analytics experience at a fraction of the cost.
If you haven’t started with DataSet yet, we invite you to try fully-functional DataSet for 30 days, completely free. Request a demo; we’d love to show you how DataSet can enable all your teams to troubleshoot Kubernetes efficiently.